| 0000 UTC |
 |
| 0200 UTC |
 |
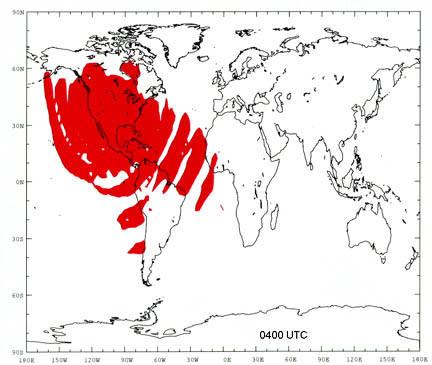
| 0400 UTC |
 |
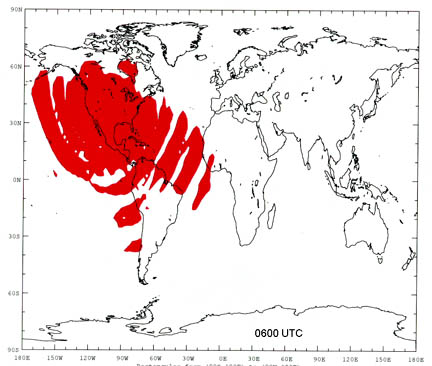
| 0600 UTC |
 |
|
|
|
|
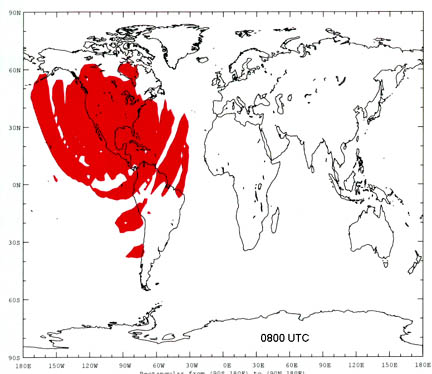
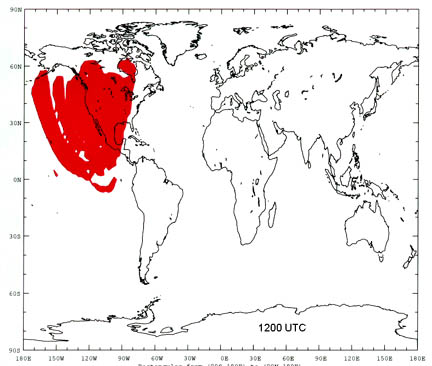
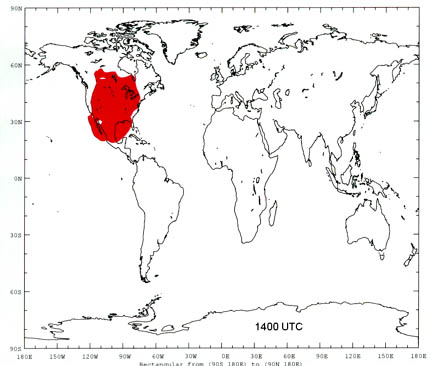
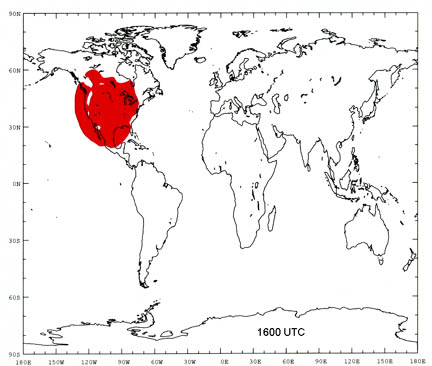
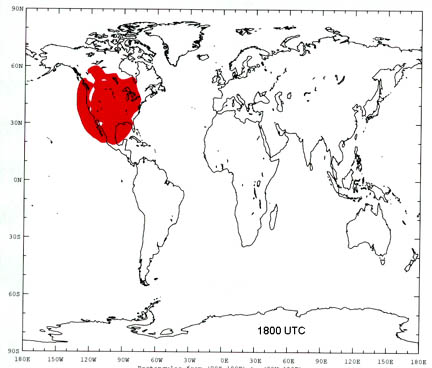
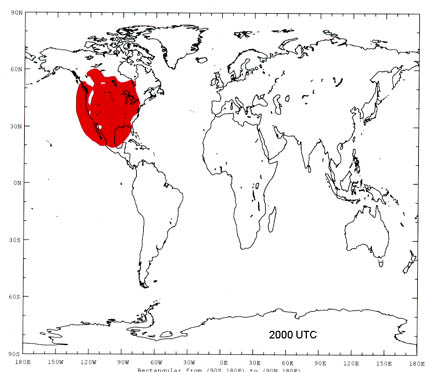
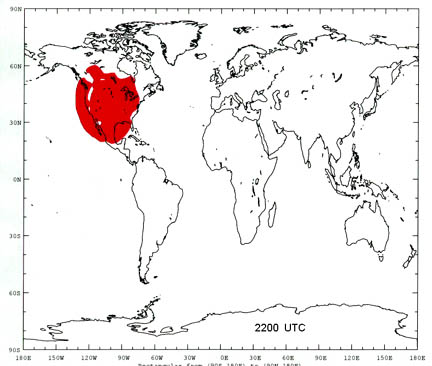
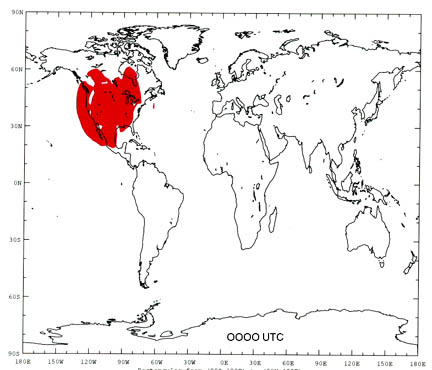
WWVB Coverage Area
|
|
|
|
|
| Return to WWVB Home |
The coverage maps shown below are computer-generated estimates of WWVB signal strength under typical conditions. They show estimated signal coverage at two-hour intervals over the course of a day with WWVB operating at 50 kW radiated power. The shaded areas indicate those areas where signal levels are 100 microvolts per meter or greater. Note that the coverage area contracts during daylight hours and expands during nighttime hours.
|
|
|
|
|
|
|
|
|
|
|
|
![]()