
|
|
|
|
Optical Ramsey
fringes w/ shelving detection
|
|
|
|
|
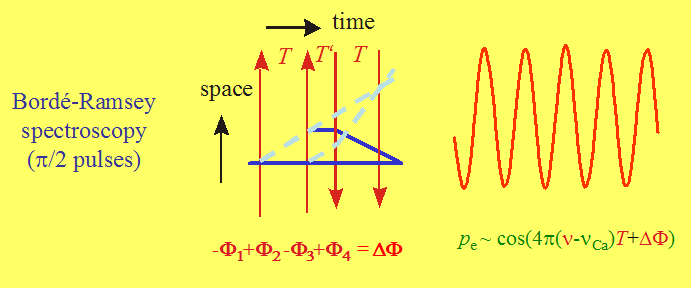
Atomic excitation – Bordé-Ramsey spectroscopy
To achieve high resolution while maintaining a good signal-to-noise ratio, we use the spectroscopic technique of Bordé-Ramsey fringes, which is the optical analog of microwave Ramsey fringes. With this method the freely-expanding atoms are excited by four p/2 pulses of 657 nm light, two in one direction followed by two in the opposite. (The need for four pulses rather than two as in the microwave case is a result of the much larger first order Doppler shift.) This sequence was identified by Ch. Bordé as generating an atomic interferometer with two closed paths, one for each recoil component. This interferometer is frequency sensitive – a sinusoidal pattern results when one scans the frequency of the probe laser, where the period of the resultant fringes is determined by the time separation within each pair of pulses. So to go to high resolution, we simply increase the time, T, between pulses with the fringe linewidth = 1/4T.
The principal advantage of this technique for our work is that we excite the atoms with short pulses (1-2 ms) with broad Fourier content. Each pulse is then able to excite a sizable fraction of the Doppler distribution (several MHz broad for millikelvin atoms) independent of resolution, which is determined solely be the time separation between pulses. This is in contrast to saturation spectroscopy with a single pulse from each direction, where the resolution is determined by the duration of the pulse. In this case high resolution pulses would only excite a narrow slice of the velocity distribution, greatly reducing the available signal-to-noise ratio.
Normalized shelving detection of the atomic excitation
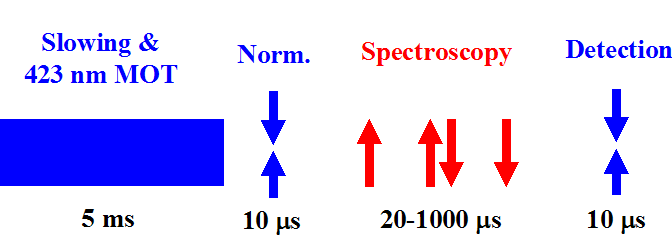
We have experimented with two strategies for detecting the excitation induced by the red pulses. The first was simple detection of the red fluorescence during the 400 ms decay time of the excited 3P1 state. Here the signal-to-noise ratio was limited by poor fluorescence collection, low quantum efficiency of photomultiplier tubes at 657 nm, and fluctuations in the number of trapped atoms. To overcome these limitations, we now use a technique first applied to trapped ion spectroscopy (for details visit the NIST Ion Storage publications website), where a strong transition is used to monitor level populations which are modified by a weak transition. In our application of this shelving technique, we use a nearly resonant 423 nm standing wave pulse to measure the ground state population before and after red excitation. These blue pulses are 10 ms long and propagate collinearly with the red probes. So our measurement sequence begins with the first blue probe pulse directly after trap turn-off. During this pulse we collect the induced blue fluorescence, which is proportional to ground state population (after background subtraction, which is ~10% of the signal). Next follows the red excitation sequence which transfers some fraction (typically ~25%) of the population to the 3P1 excited state, from which it will decay with a 400 ms time constant. However, during the first 10 ms of this decay time we illuminate the atoms with a second blue pulse to measure the population remaining in the ground state. After background subtraction, the ratio of fluorescence collected during the second blue pulse to that during the first yields the fraction of atoms excited by the red pulse sequence. We perform this division either in software (for computer-controlled scans) or hardware (for live scans), and the resultant excitation is then expressed in terms of the fraction of atoms excited.
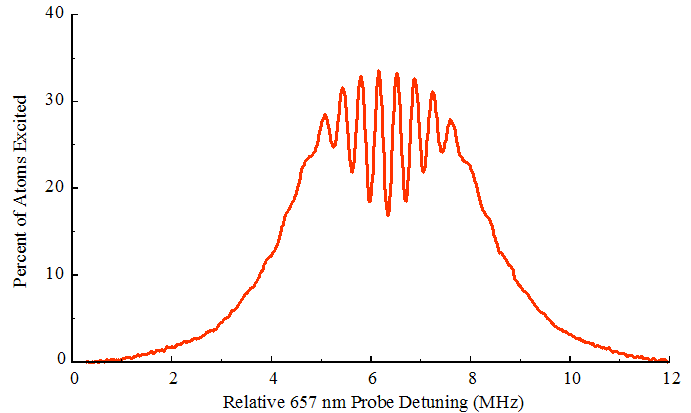
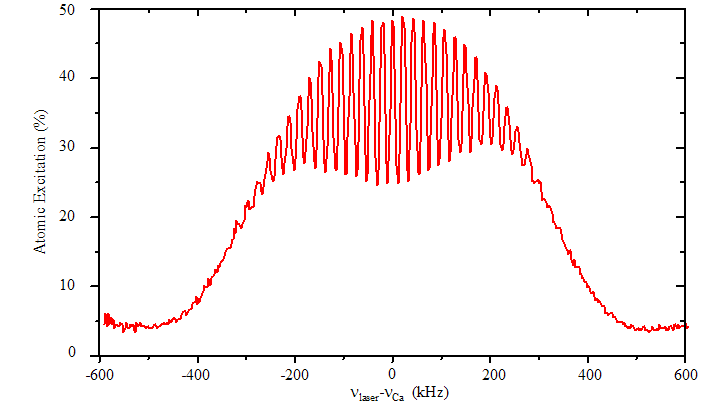
Shelving improves our signal-to-noise ratio in two ways. First, we can cycle tens or hundreds of photons per atom with the strong blue transition, which coupled with the higher PMT efficiency at 423 nm (23%) brings us close to the limit in which we detect one photon per atom per measurement cycle. In this "atom projection noise" regime (first investigated in trapped ion spectroscopy), the quantum noise is determined not by the shot noise of the collected photons, but by that of the atom number itself. This limit offers us potentially a factor of >20 improvement over the red detection shot noise limit (which is photon-limited). Second, our ratio or normalization procedure reduces the sensitivity of our blue detection system to trap number fluctuations, blue intensity and frequency noise, and other detection noise. At the top of this page we show a fringe picture taken with millikelvin atoms at low resolution with 20 seconds of data collection (for higher resolution scans see Sub-kilohertz Optical Spectroscopy w/ Trapped Ca Atoms).
Normalized shelving detection with microkelvin atoms
When we work with atoms cooled to below 10 mK with second-stage laser cooling, we need to modify this normalized shelving detection scheme. In order to avoid heating the atoms before the red spectroscopic sequence, we move the normalization pulse to the end of the measurement sequence. At the end of the red excitation pulses we quickly measure the ground state population. The atoms in the excited state then are sent back to the ground state with a green quenching pulse (the same light used to accelerate the cooling process in the second stage quenched cooling):
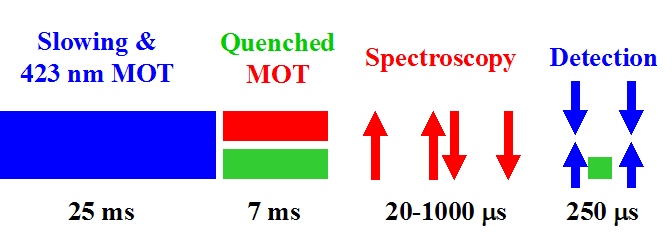
With all atoms now in the ground state we now read out the total atom number for the normalization procedure outlined above. The fringe pattern shown below are taken at low resolution with 10 mK atoms. The higher contrast results from the narrower velocity distribution, whose Doppler width is only a fraction of the Fourier-limited envelope – this means that all of the atoms contribute virtually identically to the signal. The asymmetry in the envelope is caused by atomic recoil effects and is well explained by theory.
![]()